Presenting
India's Premier Factor Investing Competition is back. Bigger and more competitive than before. Season 3 is now live. Register now and take on real-world challenges faced by investment managers.
Register Now

India's Premier Factor Investing Competition is back. Bigger and more competitive than before. Season 3 is now live. Register now and take on real-world challenges faced by investment managers.
Register Now
| Active Investing | Rule-Based Investing | Passive Investing | |
| Investment Decision-Making |
Relies on human judgment, research, and discretionary decisions by portfolio managers. | Based on pre-defined, systematic rules or models, often derived from factors. | Follows a benchmark index with minimal decision-making, replicating its performance. |
| Objective | To outperform the market (generate alpha) through stock-picking and market timing. | To outperform traditional market-cap-weighted indices by capturing specific factor premiums (smart beta). | To match the performance of a benchmark index (beta replication). |
| Use of Factors | Not very predominant | Predominant | Depends on the Benchmark Index |
| Portfolio Characteristics | Different from Benchmark | Different from Benchmark | Same as Benchmark |
Factor Investing is known by many names… Rule-based Active Investing, Quantitative Investing, Quants, Smart Beta, and Smart Alpha are a few commonly used terms

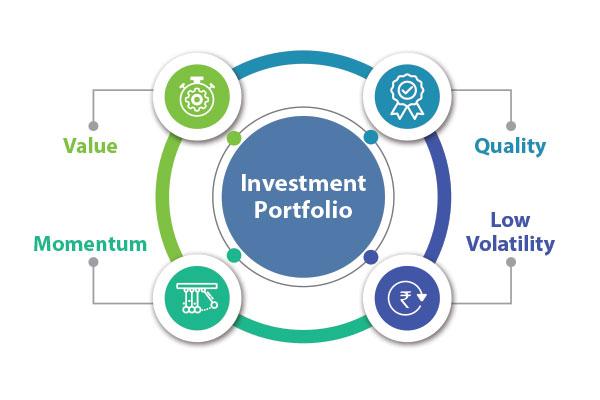
Factors are the parameters based on which professionals make investment decisions.


Quality factor focuses on fundamentally strong companies that consistently reflect positive earnings, have healthy balance sheets, and are profitable even in seemingly tough market periods.

Value factor focuses on investing in stocks that are undervalued relative to their intrinsic value. Investors applying the value factor hope that these underpriced securities will eventually gain price and achieve their real value.

Low volatility factor searches for stocks exhibiting price volatility less than that prevailing in the overall market. These stocks are considered more stable and hence do not display high price movements.
Momentum factor capitalises on securities that have been performing well in the recent past and are anticipated to continue to exhibit similar performance in the near future.
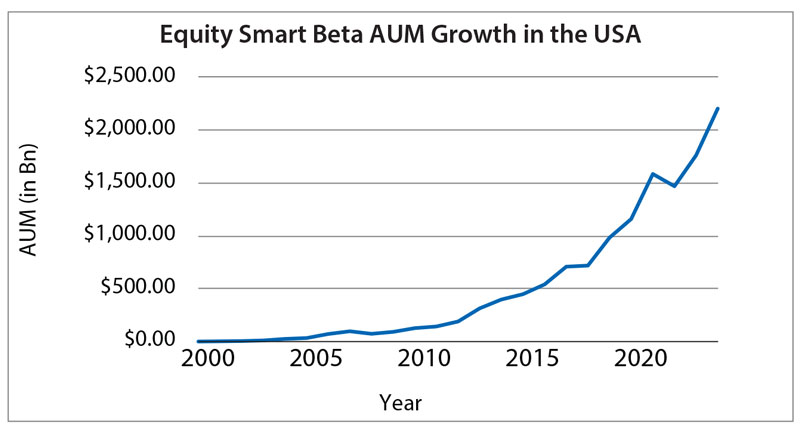
Source: Bloomberg Intelligence. Data as on 31st December 2025
| TIME PERIOD | AUM GROWTH |
| Last 3 Years | 23.44% |
| Last 5 Years | 19.41% |
| Last 10 Years | 20.18% |
| Last 15 Years | 22.99% |
| Since 2000 | 36.65% |
Source: Bloomberg Intelligence. Data as on 31st December 2025
| Factor | Factor-wise Growth over the Last Decade | |||||
|---|---|---|---|---|---|---|
| Number of Factor Based ETFs | Equity Smart Beta AUM | |||||
| No. of factor-based ETFs in 2015 | No. of factor-based ETFs in 2025 | Growth | AUM as of 31st December 2015 (In US $ million) | AUM as of 31st December 2025 (In US $ million) | AUM Growth | |
| Quality | 12 | 62 | 17.85% | 5,586.13 | 142,413.52 | 38.24% |
| Value | 48 | 125 | 10.04% | 98,957.10 | 656,584.10 | 20.83% |
| Momentum | 26 | 35 | 3.02% | 5,905.24 | 56,159.81 | 25.26% |
| Low Volatility | 29 | 52 | 6.01% | 24,528.04 | 62,024.42 | 9.72% |
| Size | 57 | 60 | 0.51% | 32,247.20 | 166,436.34 | 17.84% |
| Growth | 35 | 103 | 11.40% | 114,497.92 | 807,142.98 | 21.57% |
| Multi-factor | 118 | 189 | 4.82% | 41,872.17 | 286,504.35 | 21.21% |
| Others | 115 | 400 | 13.28% | 129,060.11 | 667,415.93 | 17.86% |
| Total | 440 | 1026 | 8.84% | 452,653.90 | 2,844,681.46 | 20.18% |
Source: Bloomberg Intelligence.
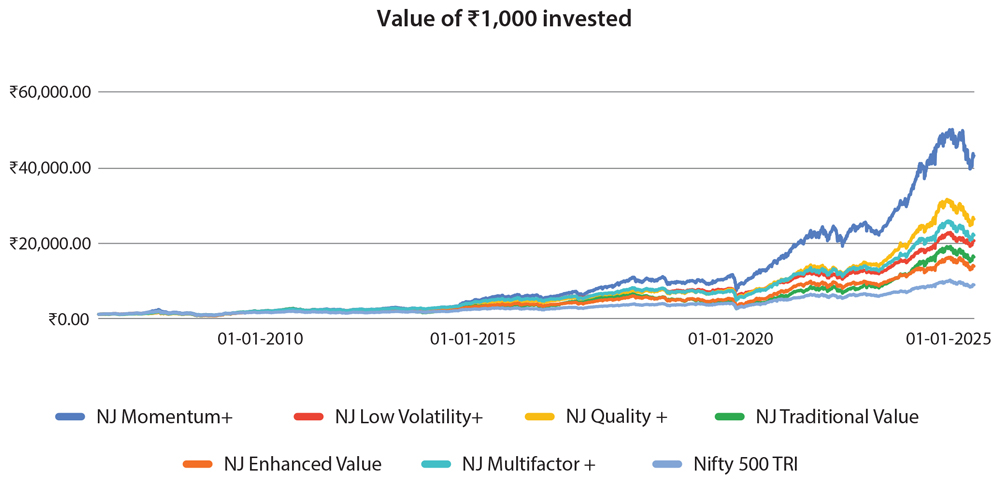
Source : Internal research, Bloomberg, CMIE, National Stock Exchange. Calculations are for the period 30th September 2006 to 31st March 2026. NJ Traditional Value Model, NJ Enhanced Value Model, NJ Quality+ Model, NJ Momentum+ Model, NJ Low Volatility+ Model and NJ Multi-Factor+ Model are proprietary methodologies developed by NJ Asset Management Private Limited. The methodologies will keep evolving with new insight based on the ongoing research and will be updated accordingly from time to time. Past performance may or may not be sustained in future and is not an indication of future return.


